Pearson Correlation coefficient,
Let’s start with the basics.
This denotes that the matrix A and B are
highly correlated.
MATLAB CODE:
Example: 1
A= [1 4 7; 2 5 8; 3 6 9]
B = A*2
%Find the average of the
matrix A
meanA = mean2(A);
%Find the average of the
matrix B
meanB = mean2(B);
%Subtract the average value
from matrix A
Asub = A-meanA;
%Subtract the average value
from matrix B
Bsub = B-meanB;
%Covariance of matrix A and
matrix B
covAB = mean2(Asub.*Bsub);
%Find the standard
deviation of the matrix A
stdA = std(A(:),1);
%Find the standard
deviation of the matrix B
stdB = std(B(:),1);
%Find the correlation
Cofficient
Rho = covAB./(stdA*stdB)
Example: 2
%Assign new values to B
B = [9 6 3;8 5 2; 7 4 1];
Rho = corr2(A,B)
EXPLANATION:
In the first example, both A and B are
highly correlated. The correlation coefficient is 1, whereas in example 2, the correlation
coefficient is -1.
Consider
the reference image as template image which will be larger in size and search
image as target image usually smaller in size.
In Principles of
Digital Image processing, algorithm 11.1(pg.262) , a clear explanation of template matching
algorithm is given.
Template Matching using MATLAB command ‘normcorrx2’:
MATLAB CODE:
%Read an Image A(Template)
A1 = imread('benten.jpg');
%Read the Target Image
B1 = imread('watch.jpg');
A = A1(:,:,1);
B = B1(:,:,1);
normx_corrmap=normxcorr2(B(:,:,1),A(:,:,1));
maxptx = max(normx_corrmap(:));
[x1,y1]=find(normx_corrmap==maxptx);
figure,
imagesc(A1(x1-size(B,1):x1,y1-size(B,2):y1,:));axis
image
NOTE: ‘normxcorr2’ is the normalized
cross correlation.
Template Matching in Spatial Domain:
MATLAB CODE:
A1 = imread('benten.jpg');
%Read the
Target Image
B1 = imread('watch.jpg');
A = A1(:,:,1);
B = B1(:,:,1);
corr_map =
zeros([size(A,1),size(A,2)]);
for i = 1:size(A,1)-size(B,1)
for j = 1:size(A,2)-size(B,2)
%Construct the correlation map
corr_map(i,j) = corr2(A(i:i+size(B,1)-1,j:j+size(B,2)-1),B);
end
end
figure,images(corr_map);colorbar;
%Find the maximum value
maxpt = max(corr_map(:));
[x,y]=find(corr_map==maxpt);
%Display the image from the
template
figure,imagesc(B1);title('Target Image');colormap(gray);axis
image
grayA = rgb2gray(A1);
Res = A;
Res(:,:,1)=grayA;
Res(:,:,2)=grayA;
Res(:,:,3)=grayA;
Res(x:x+size(B,1)-1,y:y+size(B,2)-1,:)=A1(x:x+size(B,1)-1,y:y+size(B,2)-1,:);
figure,imagesc(Res);
EXPLANATION:
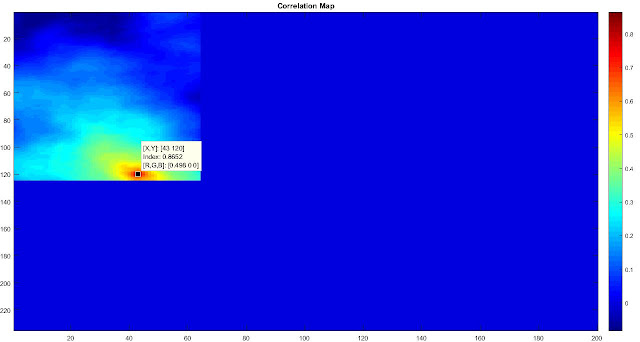
MATLAB command ‘corr2’ is used to find the correlation
coefficient. The Target Image is placed over the template image and correlation
coefficient for each pixel in the template image is found to construct the
correlation map. After sliding through all the pixels in the template image,
the maximum coefficient is obtained from the map. The pixel position with
maximum value is the starting point of the target image.
In the above example, maximum value is 0.8652 and the pixel
positions corresponding to this value in correlation map(x,y) is (120,43)
 |
| Template Image + |
 |
| Target Image = |
Template Matching in Frequency or Fourier Domain:
%Read two images of same scene
A = imread('Image1.jpg');
B = imread('Image2.jpg');
figure,subplot(2,1,1);imagesc(A);title('Image 1');axis image
subplot(2,1,2);imagesc(B);title('Image 2');axis image
%Crop a part from the image matrix B
B = imcrop(B,[58.5 49.5 226 102]);
figure,imagesc(B);title('sub Image - Image 2');axis image
%Pad the image matrix B with zeros
B1 = zeros([size(A,1),size(A,2)]);
B1(1:size(B,1),1:size(B,2))=B(:,:,1);
%Apply Fourier Transform
Signal1 = fftshift(fft2(A(:,:,1)));
Signal2 = fftshift(fft2(B1));
%Mulitply Signal1 with the conjugate of Signal2
R = Signal1 .*conj(Signal2);
%Normalize the result
Ph = R./abs(R);
%Apply inverse fourier transform
IFT = ifft2(fftshift(Ph));
figure,imagesc((abs((IFT))));colormap(gray);
 |
| Correlation Map |
%Find the maximum value
maxpt = max(real(IFT(:)));
%Find the pixel position of the maximum value
[x,y]= find(real(IFT)==maxpt);
figure,subplot(1,2,1);imagesc(A(x:x+size(B,1),y:y+size(B,2),:));axis image
subplot(1,2,2);imagesc(B);axis image
EXPLANATION:
The above implementation is based on normalized cross correlation in Fourier domain.Also known as phase correlation. The two images used here are different snapshots of the same scene. ‘Image1.jpg’ is used as template image and a sub image from the ‘Image2.jpg’ is used as target image. The target image is padded with zeros to match the size of the template image. After Fourier transform, the template signal is multiplied with the conjugate of the target signal and normalized. Then inverse Fourier is applied and the pixel position corresponding to the maximum value is extracted.
The maximum value is 0.0374 and the pixel positions (x,y) is(59,78). From the correlation map, it is evident that the maximum value is at the pixel position(59,78).


 :)
:)
 :(
:(
 :))
:))
 :((
:((
 =))
=))
 =D>
=D>
 :D
:D
 :P
:P
 :-O
:-O
 :-?
:-?
 :-SS
:-SS
 :-f
:-f
 d(
d(
 :-*
:-*
 b-(
b-(
 h-(
h-(
 g-)
g-)
 5-p
5-p
 y-)
y-)
 c-)
c-)
 s-)
s-)
 d-)
d-)
 w-)
w-)
 :-h
:-h
 :X
:X


5 comments:
What's SZ , Var=sqrt(((Mean2-(Mean^2*sz))));
@fidasjfiodasf
Here sz means the size of the image.
what is IR for, numer=(IR-(Irs*Mean*sz)); ?
@force353
IR is the summation of (Template image portion x target image portion)
someone can help me, I'm confuse about how to creat template matching for number plate......
Enjoyed Reading? Share Your Views